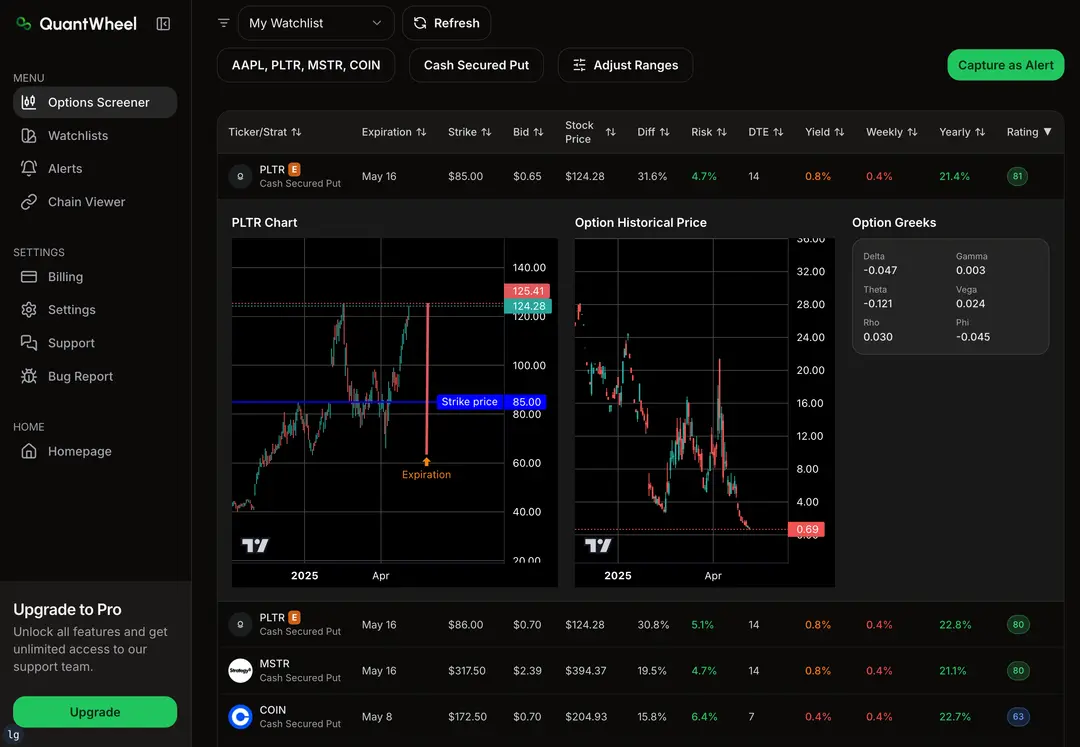
Options Chain Basics
An options chain lists all available contracts for a specific stock.
It organizes these contracts in a table, splitting calls and puts into separate columns with their pricing info.
Strike Price: What to Know
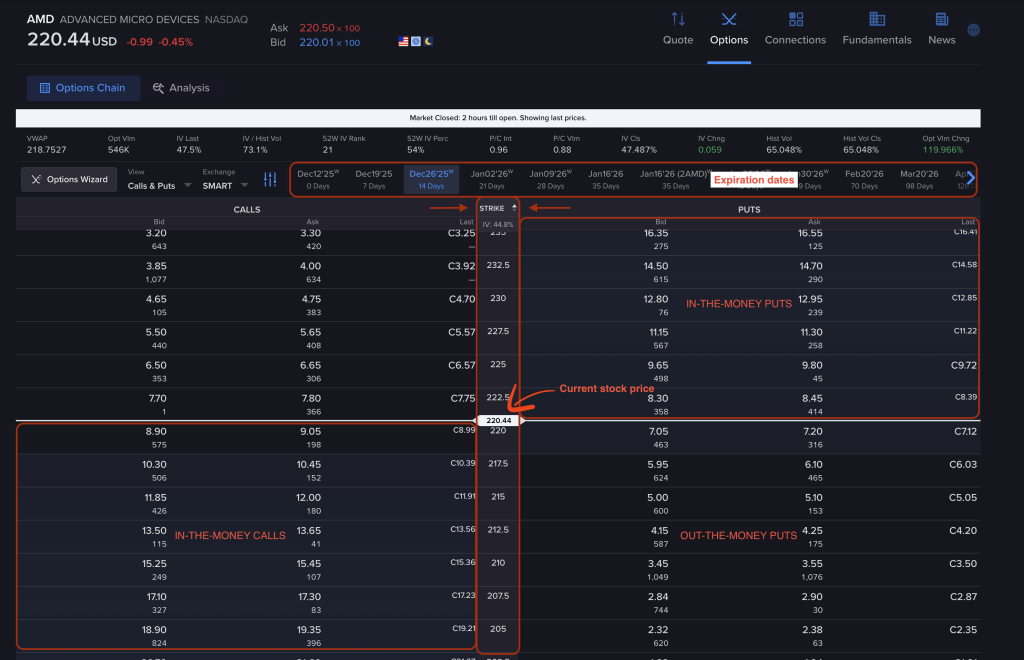
The strike price is the price where you can exercise an option contract. You’ll usually find this number in the middle column of an options chain
Strike prices can be sorted to go from low to high or high to low.
For most stocks, they’re spaced at regular intervals, like $1, $5 or $10 apart.
In-the-money options have strike prices that work in your favor compared to the current stock price. For calls, that’s a strike below the current price; for puts, it’s above.
Out-of-the-money options have strikes that aren’t favorable compared to the current price. These options don’t have intrinsic value, but they might still have time value.
The number of strike prices depends on the stock’s price and trading activity. Popular stocks usually offer more choices.
Expiration Dates and How Long Contracts Last
Options contracts all have set expiration dates. This gives traders a limited window to act.
Most chains group contracts by expiration, starting with the soonest.
You can find expiration dates most often at the top of the chain.
Option prices drop as expiration nears, with time value fading faster in the last weeks.
Longer-term contracts (LEAPS) can go out two years, but they cost more since they give extra time for things to happen.
You’ll want to pick expiration dates that match your market view and strategy.
Each expiration date has a different chain with its own strike prices.
Calls and Puts: Two Sides of the Chain
Options chains split call and put contracts onto different sides.
Calls usually show up on the left, puts on the right of the strike column.
Call options let you buy shares at the strike price.
Put options let you sell shares at the strike.
Both sides show the same key data: bid, ask, volume, and open interest.
The bid is what buyers want to pay; the ask is what sellers want to get.
You want lower prices (closer to bid) when buying calls or puts.
You want higher prices (closer to ask) when selling calls or puts.
Volume tells you how many contracts traded that day.
Open interest shows how many contracts are still open and haven’t been closed or exercised.
How to Read Options Chain Data
The options chain table gives you a bunch of pricing and market info you need to make decisions.
If you get how bid-ask spreads, volume, and premiums work, you’ll be better at spotting good trades – or you can use QuantWheel to do this for you.
That’s 80% of the job done for you.
Bid, Ask, and Spreads
The bid is the most buyers will pay for an option.
The ask is the least sellers will take.
These two numbers are the starting point for every options trade.
The spread is just the difference between the bid and ask. Tight spreads mean lots of trading and good liquidity. Wide spreads? Fewer traders and higher costs.
When you buy, you pay the ask. When you sell, you get the bid. The spread is an instant cost that can eat into profits.
Spread Types:
- Tight spreads (under $0.05): Easy to trade, lots of action
- Medium spreads ($0.05-$0.20): Okay liquidity
- Wide spreads (over $0.20): Not much trading, watch the fees
Market makers set these prices based on supply and demand. Big-name stocks usually have the tightest spreads.
Volume and Open Interest
Volume is the number of contracts traded today. High volume means there’s strong interest and it’s easy to get in or out.
Open interest is the total number of contracts still open. It updates daily and shows where traders are sticking around.
Volume vs. Open Interest:
- Volume resets to zero every day
- Open interest keeps rolling forward
- High volume with low open interest? That’s new positions
- Low volume, high open interest? Old positions, not much action
Look for options with high volume and open interest. They’re easier to trade and usually have smaller spreads.
Premiums: What You’re Really Paying
The premium is what you pay for an option if you buy a call or buy a put. It changes constantly as the stock price, time left, and market mood shift.
The premium is what you receive from an option trade if you sell a call or sell a put.
Premiums have two parts: intrinsic value (what you’d get if you exercised now) and time value (the extra for potential future profit).
What Impacts Premiums:
- Stock price moves: Directly changes intrinsic value
- Time decay: Eats away premium as expiration gets closer
- Volatility: More volatility means higher premiums
- Interest rates: Usually a minor factor
The chain updates premium prices in real time. Compare prices across strikes and expirations to find trades that make sense for you.
Options with more time left cost more if you’re buying them. Out-of-the-money options are cheaper but less likely to work out.
Options with more time left pay more if you’re selling them. Far Out-of-the-money options pay less but are also less likely to get assigned (this could be good or bad, depending on what you’re aiming to use them for)
Advanced Metrics and Moneyness
Understanding implied volatility and the Greeks gives you an edge in pricing and risk. Moneyness tells you if an option already has value or if it needs the stock to move.
Implied Volatility & the Greeks
Implied volatility is how much the market thinks a stock might move. More volatility means pricier options.
Delta shows how much the option price changes if the stock moves $1. Calls have delta between 0 and 1; puts run from -1 to 0.
Gamma measures how quickly delta shifts as the stock price changes. High gamma means your risk and reward can change fast.
Theta tracks how much value disappears each day as expiration nears. All options lose value over time if the stock doesn’t move.
Vega shows how sensitive the price is to changes in volatility. If volatility jumps, options with high vega get more expensive. If volatility drops, those same options lose value quickly.
Good traders check these Greeks to match their strategy and risk comfort. It’s not easy, but it’s worth it.
You can learn more about these here.
Moneyness: In, At, or Out?
Moneyness tells you if the option’s profitable right now or not.
In-the-money options have built-in profit. Calls are in-the-money if the stock is above the strike; puts if the stock is below.
At-the-money options have strike prices equal to the stock price. No immediate profit, but there’s still some time value. These get a lot of action.
Out-of-the-money options need the stock to move to become profitable. Calls are out-of-the-money if the stock is below the strike, puts if it’s above.
Out-of-the-money options are cheaper but riskier. Sellers get less for them but have better odds of keeping the premium.